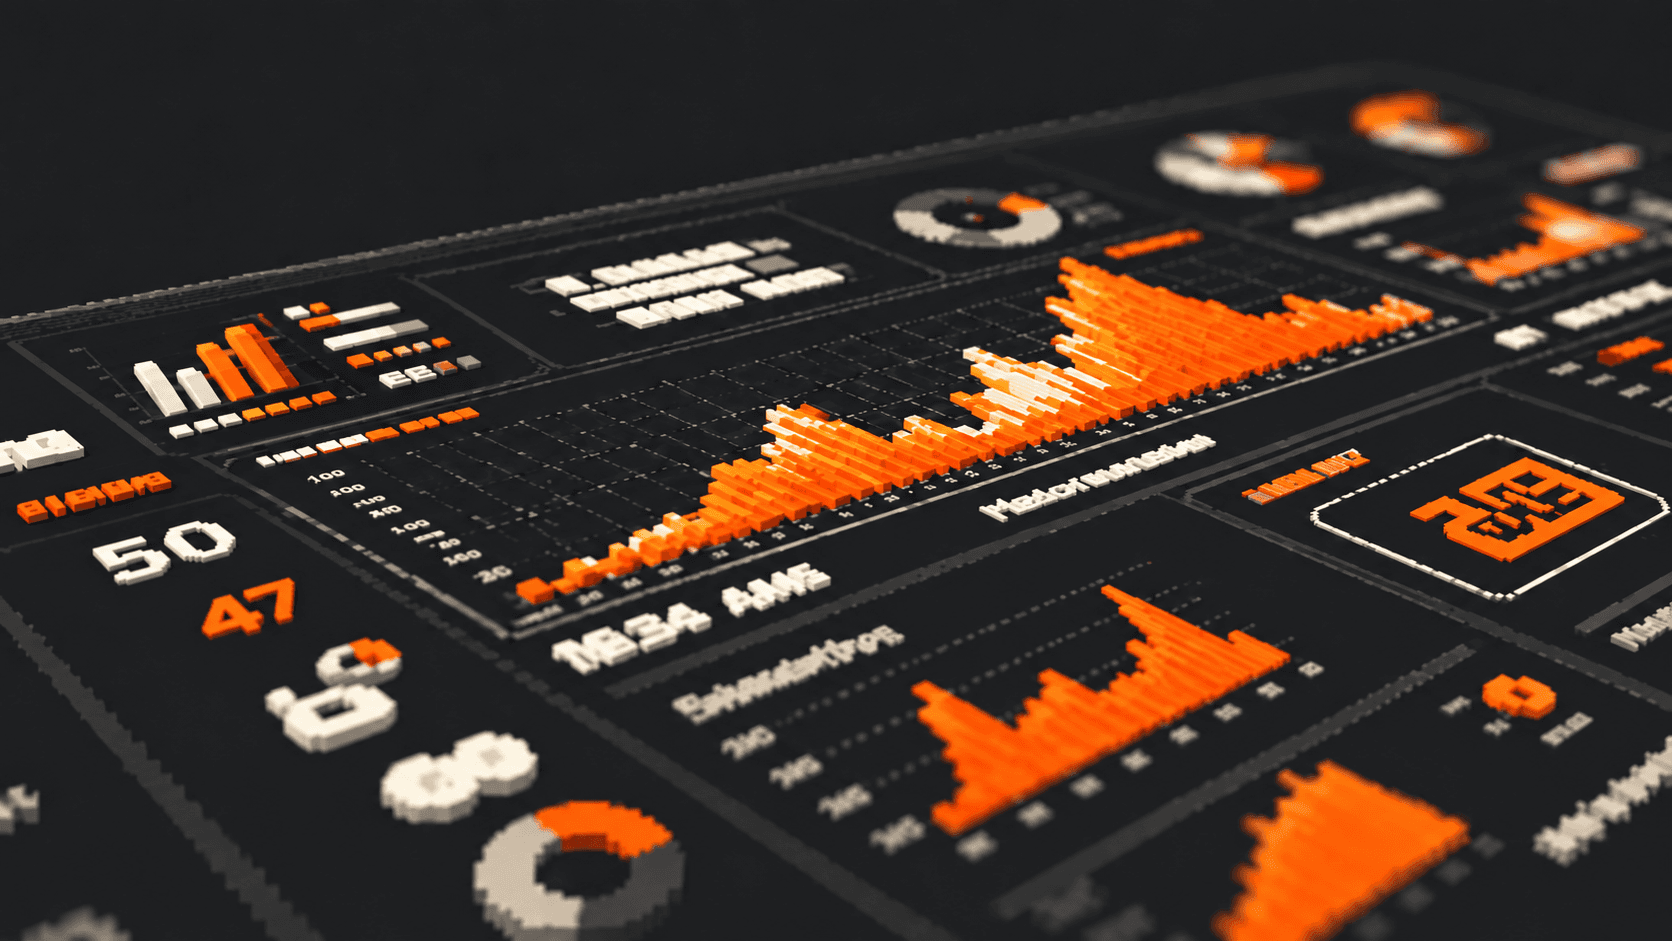
Both work with data, but serve different roles
A dashboard and a report can use the same data, yet answer different needs. One makes monitoring and exploration easier; the other adds context, interpretation and recommendations.
When we confuse the formats, dashboards become overloaded with explanations and reports repeat numbers without building a useful reading.
Monitor indicators, spot changes and find where to investigate.
Put results in context and recommend what to do next.
A dashboard shows the movement. A report helps explain it.
A dashboard helps you monitor
A dashboard brings indicators together to answer recurring questions quickly: how are we performing? Are we above or below target? Which channel is growing? Where did performance drop?
Imagine a panel with R$84.2K in spend, 1,240 conversions, 113% of target and an 18% change. KPIs and a trend line make it easy to spot growth and compare the result with the goal. These figures are illustrative, included to explain the reading.
A dashboard helps monitor, compare and explore. It points to where to look, but does not explain by itself why a change happened.
- Organizes metrics, time series, changes and targets.
- Helps locate deviations, opportunities and shifts in pace.
- Supports recurring performance monitoring.
Dashboard = monitoring + exploration.
A report helps you interpret
A report starts with a question and selects the data that can help answer it. Its role is to explain what changed, why it matters and what to do next — without repeating everything already visible in the dashboard.
For example: conversions rose 18%, with most of the increase concentrated in one channel. The analysis may show that this channel became more efficient while the others remained stable. The recommendation is to investigate what drove the improvement before replicating the strategy.
A recommendation should show the evidence behind it. If the cause is not confirmed, present it as a hypothesis and explain how to check it.
- Adds context and comparison criteria.
- Interprets changes and states analytical limits.
- Turns the reading into an actionable recommendation.
Conversions grew, with most of the increase concentrated in one channel.
That channel became more efficient while the others remained steadier.
Understand what drove the improvement before repeating the strategy.
Report = context + insight + recommendation.
The same data can lead to two readings
In the dashboard, we see 1,240 conversions, an 18% increase and a result equal to 113% of target. The reading is quick: performance grew and the goal was exceeded.
In the report, we can add that most of the increase came from one channel and that it is worth understanding what drove it. The data stays the same; the level of interpretation changes.
Monitor indicators, spot changes and find where to investigate.
Put results in context and recommend what to do next.
The same data. Two readings.
Information is not insight
A standalone number is a factual piece of information. To reach a reading that helps someone decide, connect data, comparison, interpretation and recommendation.
An insight is not the number repeated in different words. It explains what the number may mean — making clear what we know, what we infer and what action or investigation makes sense.
An insight does not repeat the number. It explains what it may mean.
Dashboards and reports do not compete
A dashboard monitors performance, identifies movement and signals where to look. A report adds context, interprets the movement and turns analysis into a recommendation.
One helps us understand where to look. The other helps us understand what to do with it. Together, they create continuity in the analysis, rather than competing for the better format.
- Monitors performance
- Identifies movement
- Signals where to look
- Adds context to data
- Interprets movement
- Recommends what to do
Dashboards and reports complement each other: one monitors, the other goes deeper.
Data needs context
A well-structured dashboard makes data easier to read. A good report turns that reading into understanding and direction.
Analysis becomes more useful when data stops being information alone and starts guiding understanding, insight and decisions.
Presenting numbers is not enough. Explain what they are saying.
Presenting numbers is not enough. We need to explain what they are saying.